Seeing the Big Picture
While a loss pick or point estimate produced from accurate analysis by an experienced actuary is valuable information, its usefulness is tempered by the likelihood of how accurate the estimate is. That is, from a statistical standpoint, the loss pick has a certain probability of being correct. That probability, measured in a confidence interval, is another piece of data that can help the end user make an informed decision. While not a perfect mathematical analogy, consider knowing that the weather forecast calls for rain and how much more informed you are if you know that chance of rain is twenty percent or ninety percent.
At their best, confidence intervals demonstrate how actual losses may vary from the projection and enable decision makers to assess the risk involved with their loss pick. At their worst, confidence intervals can sway less informed decision makers away from a specific conclusion. With appropriate interpretation, confidence intervals are an important part of a complete actuarial analysis and help you see the “big picture” of the potential for loss.
The end user of an insurance program analysis is usually a risk manager or CFO, and the end use of the analysis is to help determine the type of insurance program that will best protect the company. This will depend on:
- Expected losses
- When those losses will be paid
- The company’s risk tolerance
In a previous post, we discussed the calculation of expected losses and the value of analyzing when those expected losses will be paid. The next step in the process is to determine the mathematical probability that expected losses will or will not be exceeded. This probability has a bearing on how attractive a certain proposed insurance program really is.
Defining the Confidence Interval
The analysis of an insurance program involves either a retrospective look at the past (reserves) or a prospective look at the future (loss projection or loss pick). The example used in this article will involve a loss projection.
Often a loss projection is presented as the one and only answer. A company may analyze its historical loss experience and decide it will have $1,000,000 of losses to cover during the next policy period. This $1,000,000 is then used as input to the decision as to what type of insurance program should be constructed.
The $1,000,000 may not be the best number to use for decision making because the probability of the losses being exactly $1,000,000 is very small. A more useful way to look at this projection is to define the probability, or confidence, that $1,000,000 will or will not be exceeded. For example, if a risk manager knows there is a 45% chance that $1,000,000 will be exceeded, then a self-insured program may not seem attractive or feasible.
At the lower levels of confidence, we find low loss levels that are not very probable. At the higher levels of confidence are high loss levels that are not likely to be reached. The true loss level lies somewhere within this confidence interval. A smaller or tighter confidence interval will make decision making easier as the range of potential loss levels is reduced. A broader confidence interval will make the decisions more difficult due to the potential for very high or very low loss levels. This range of losses and their probability is also referred to as the spread of loss.
There are several methods that can be utilized to compute a confidence interval or spread of loss. As a starting point, a common method involves Monte Carlo simulation. By defining the frequency and severity of historical claims and fitting this information to certain probability distributions used within the insurance industry, a spread of loss can be calculated. Common frequency distributions include Poisson and negative-binomial. Common severity distributions include log-normal, Weibull and Pareto. These concepts move beyond the scope of this article, but it is important to understand that the actuary uses common mathematical techniques and models to complete the analysis.
For further explanation, let’s look at what issues can arise when calculating a confidence interval around our theoretical $1,000,000 loss pick.
The Issues
The first issue with confidence intervals is a concept known as parameter risk. This risk is not included in the calculation of the confidence interval. Parameter risk is the risk associated with the possible incorrect estimate of the projected losses. There is always the possibility that the estimate of projected losses is wrong. However, an actuary will use a sound actuarial methodology to project the losses in order to minimize the impact of parameter risk.
The second issue involves the selection of an appropriate model for the loss variance. You can read textbooks or buy software to help, but what you really need is a good database of loss experience. For example, if you have three years of loss experience with about ten claims a year, there is not much value in calculating confidence intervals because you simply don’t have enough data to be statistically significant. If you have five years experience with five hundred claims a year, then you have sufficient information to select an appropriate model. Most companies will have something between these extremes.
If there is enough data to generate a valid analysis, then a common approach is to select frequency and severity distributions that best fit the historical data. Then a simulation can be built to generate 100 to 5,000 years of possible outcomes. Ordering the results of the simulation will give the confidence interval. There are also direct analytical methods for determining a confidence interval, which may look like the chart shown here.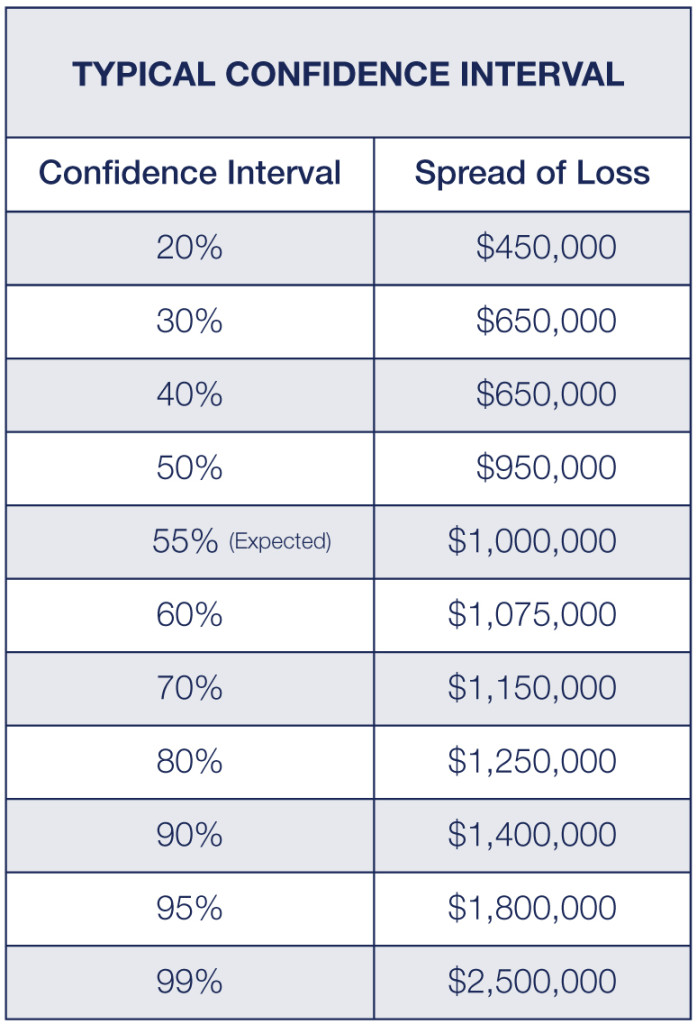
This chart indicates that the $1,000,000 loss pick will not be exceeded 55% of the time. However, this means that there is a 45% chance the $1,000,000 will prove to be low. 80% of the time, $1,250,000 will be adequate to fund the expected loss experience. And, 5% of the time, $1,800,000 will not be enough to fund the expected loss experience.
Risk adverse clients may be happy with a $1,000,000 loss pick. However, they may balk at the potential of a $1,250,000 loss year. This is where the value of an analysis of confidence intervals is critical to the decision making process.
Elements that Determine the Confidence Interval Spread
The spread around a loss pick will vary by line of coverage, industry, geography and credibility of the inputs. Workers compensation usually has a fairly “tight” spread relative to products liability. But even within workers compensation, differences in the spread occur. For example, heavy manufacturing, with a higher probability of shock claims than many office operations, has a greater variability of potential loss. Because of varying distributions, it is important to utilize historical claim data similar in nature to the expected future claims.
We welcome your feedback by posting a comment, or contact me at TLC@SIGMAactuary.com.
I have heard worker’s Comp. insurance companies often use a higher confidence level to be conservative and to increase reserves as an offset against current income. What confidence level is typical in the industry?
For workers compensation, the actuarial expected level generally falls around the 55th to 60th percentile. Companies that choose to be conservative will generally book a little above this level.