A workers compensation loss analysis can be utilized in a number of ways depending on the situation and needs of the user. Reserve certification, satisfaction of self-insurance requirements, negotiation of security requirements and letters of credit, insurance budgeting, and determining the reasonability of quoted insurance costs are all common uses. Loss development serves as the basis of a loss analysis and is generally the first step, but from there, subsequent methodology can take many forms. Today, we’ll be exploring each possible step of the process in more detail.
Loss Development Analysis
A loss development analysis tracks the historical development of a loss portfolio at annual evaluations. One method, which utilizes reported (or incurred) losses, is called the Incurred Development Method and assumes that reporting patterns and reserving practices are consistent over time. Another, which utilizes paid losses, is called the Paid Development Method and assumes that payment patterns and settlement practices are consistent over time. Once these historical patterns have been examined, loss development factors can be estimated and then applied to the most recent evaluation of losses, resulting in an ultimate loss estimate for each policy period.
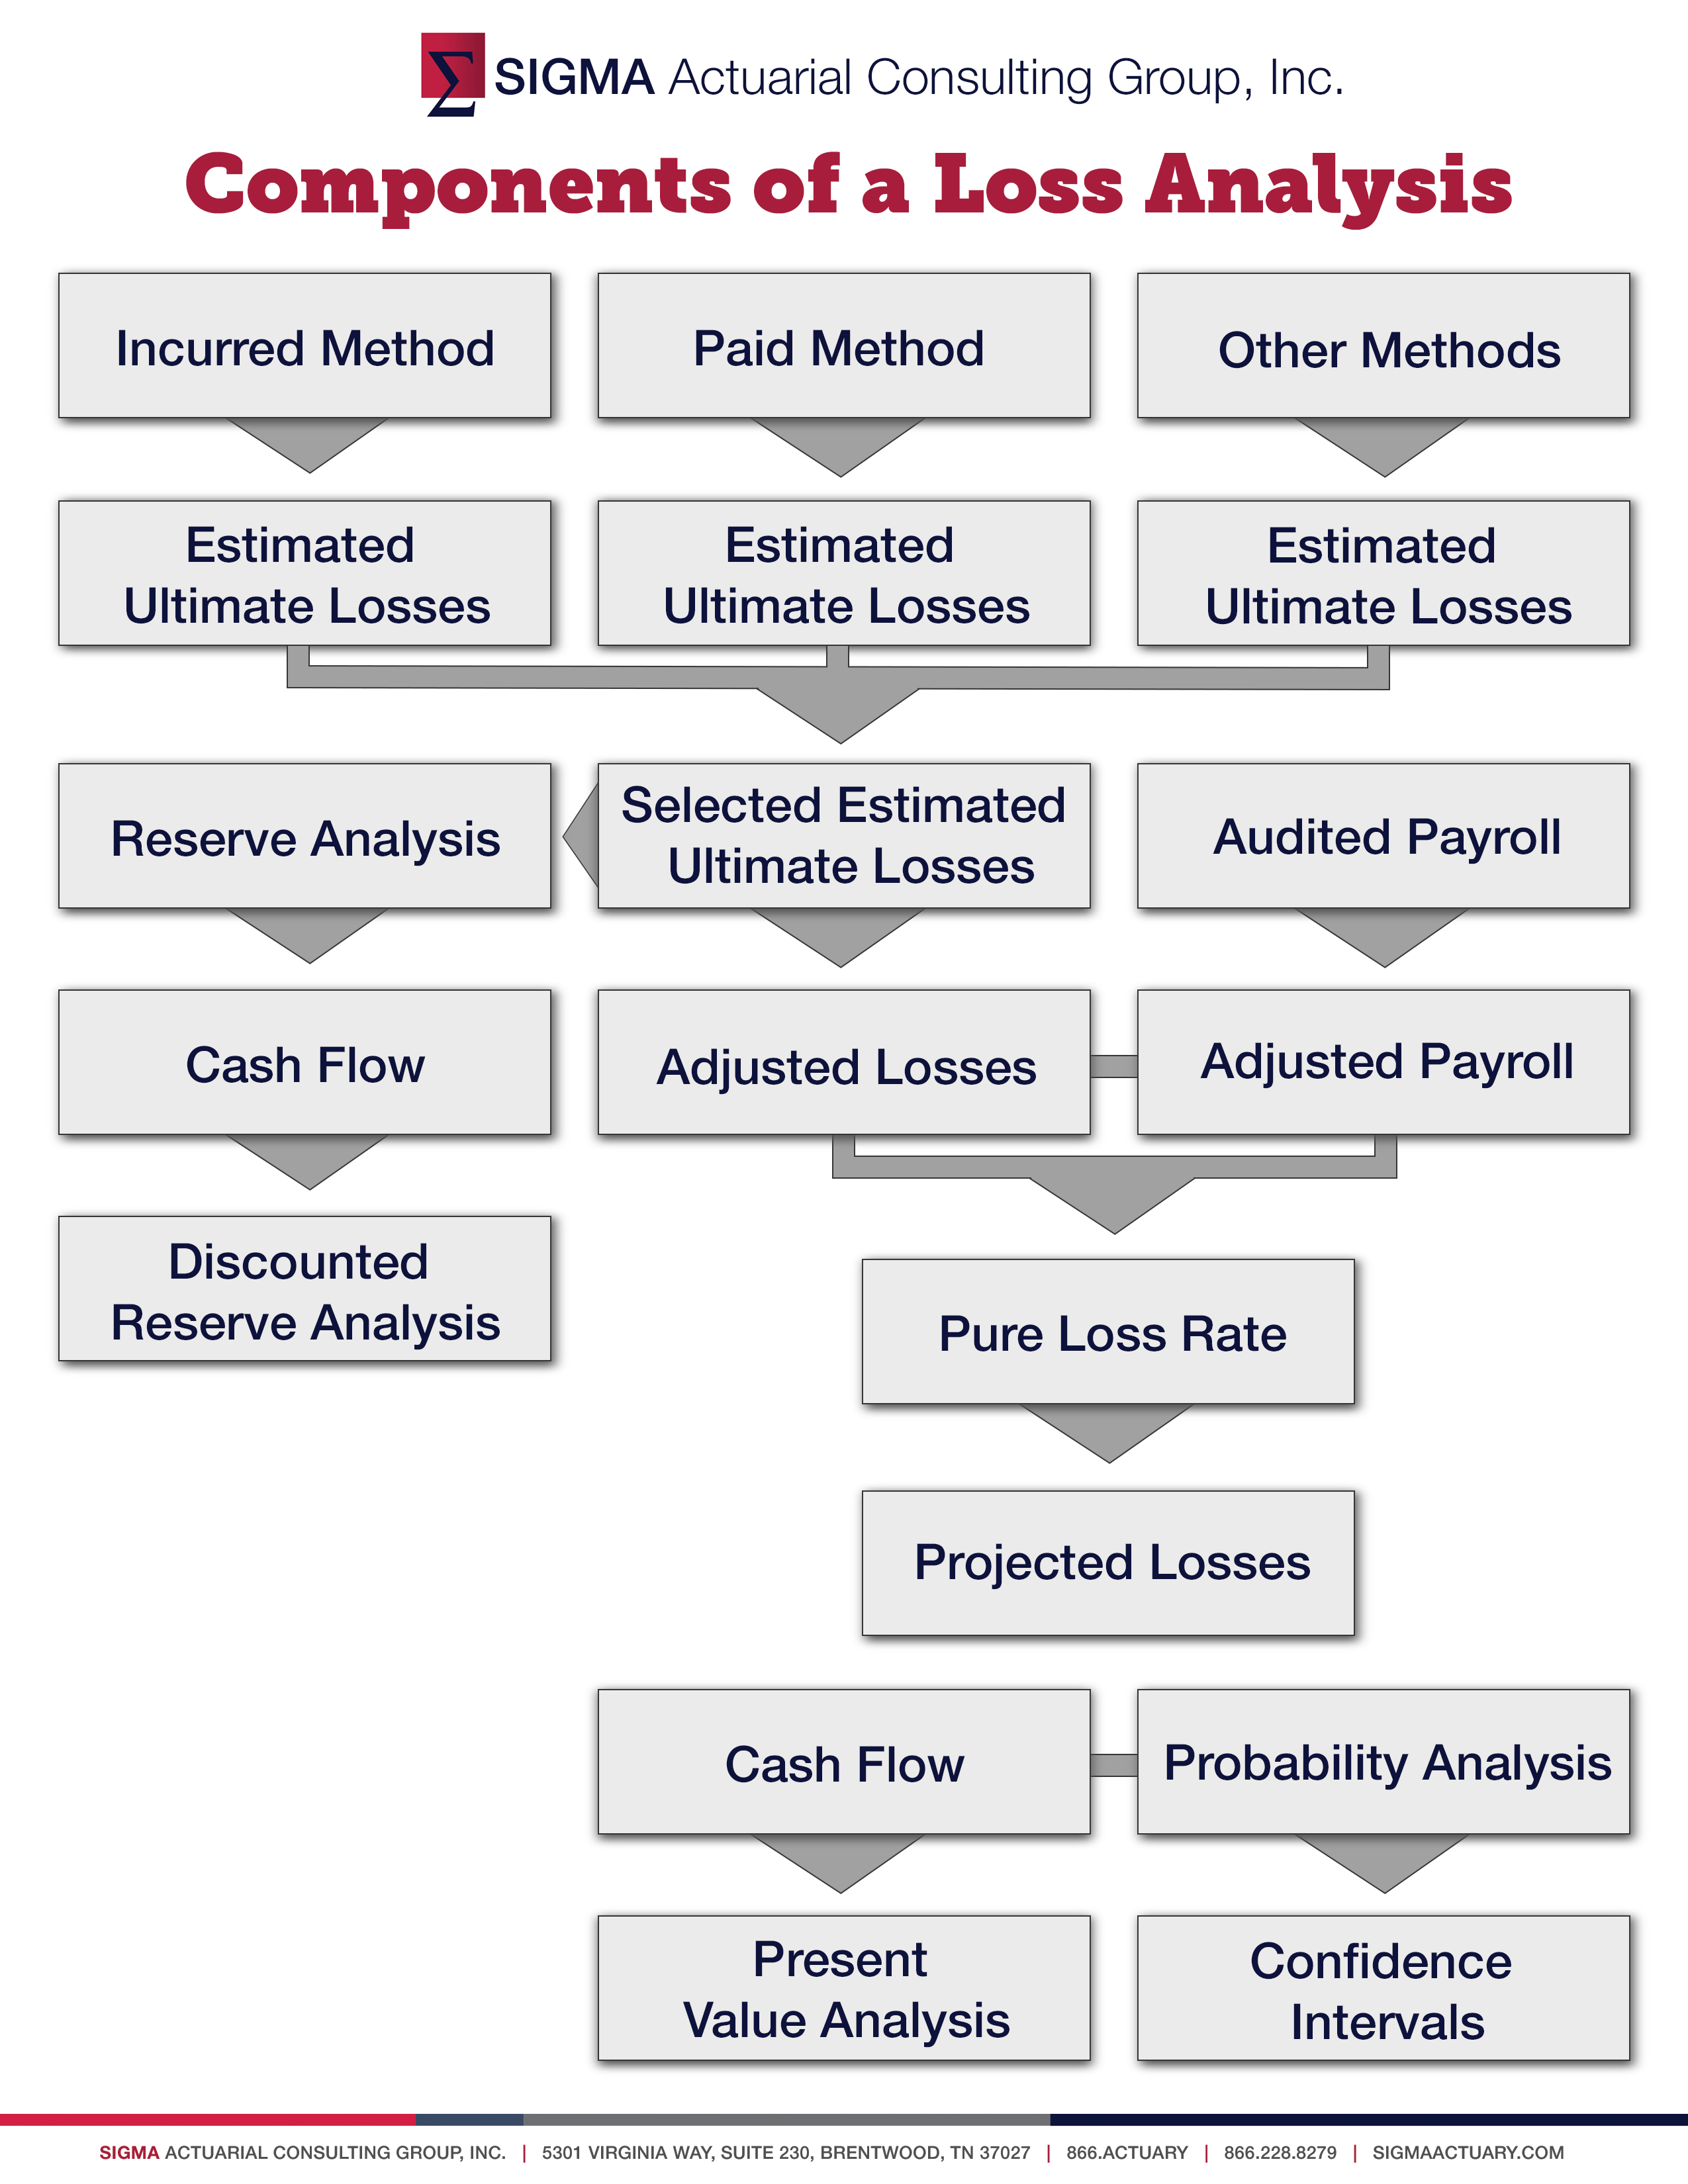
Depending on the amount of data available, other methods may be utilized as well. After a range of ultimate loss estimates has been calculated, a weighted average of the methods is taken based on their credibility to create selected estimated ultimate losses. From there, the ultimate losses may be used as inputs to a reserve analysis, carried forward to a loss projection analysis, or both.
Reserve Analysis
A reserve analysis is used to satisfy various regulatory requirements. Current paid losses are subtracted from the selected estimated ultimate losses to yield an estimate of required reserves. A cash flow analysis can also be created using the estimated required reserves and paid loss development patterns. Then, a discount factor is incorporated into the analysis to estimate the present value of these liabilities.
Since workers compensation losses are generally settled over an extended period of time, the money held in reserve earns interest, and the time value of money can be a major factor. For coverages with similar or longer “tails”, the recognition given future investment earnings can have an important bearing on needed security levels.
Loss Projection Trend Adjustments
When utilized as input to a loss projection, the estimated ultimate losses are restated through the use of benefit level change factors, payroll trends, and medical cost trends, which allows them to be examined at a common loss date. Appropriate trend factors should be selected based on knowledge of the industry or company. An exposure base is also utilized as a way to quantify the company’s exposure to loss in a specific coverage. Commonly, the base used for workers compensation is payroll, which must be restated to a common loss date as well using payroll trends.
Pure Loss Rate Calculation
A policy period’s pure loss rate is calculated as the adjusted loss amount divided by the adjusted payroll. Since the losses and payrolls have been restated to a common basis, a credible comparison can be made between the actual loss experience for each period. In most cases, it is suggested that at least five to seven periods be analyzed so that characteristics common to the implementation of a loss control program, random large losses, plant closings, and acquisitions/divestitures do not significantly bias the data.
Loss Projection
Once every period’s pure loss rate has been calculated, a selection must be made, which requires both careful analysis and judgment. A straight average of each period is usually not the best selection unless the rates are very stable. For example, steadily decreasing rates could indicate that a loss control program is working. An erratic set of rates could indicate that the company is plagued by infrequent, but serious, large losses. The closing of a plant could cause one or two of the years to show a large rate relative to the other years. To help simplify decision-making, acquisitions or divestitures should usually be segregated in this part of the analysis. Once all relevant information has been analyzed, a pure loss rate that is most indicative of the projected period should be chosen.
The rate is then applied to the projected payroll, resulting in a point estimate of losses for the projected period. Assuming historical experience is indicative of future experience, companies should feel comfortable with this estimate, but there may be a wide range of possibilities around it due to internal and external factors.
Additional Analyses
When a point estimate is not sufficient for the user’s needs, variability and volatility may also be quantified using a probability distribution, which shows the practical application of the work completed in estimating the projected losses. Once complete, confidence levels based on this distribution are calculated, allowing the company to choose a funding level according to their appetite for (or aversion to) risk.
Two more steps can be undertaken once an appropriate funding level has been established: a cash flow exhibit will show estimated payouts for the projected period over time, and a discount analysis can show the present value of the projected losses.
The above graphic and other PDF resources are available for download from our complimentary RISK66 Education Portal. If you are already a RISK66 subscriber, click here to login and download this graphic. If you are not, but would like access to this video and other complimentary educational resources, click here to sign up.
We welcome your feedback by posting a comment or contacting Tim at tlc@SIGMAactuary.com.
© SIGMA Actuarial Consulting Group, Inc.
NOTE: This article uses workers compensation as an example only, and the techniques discussed are generally applicable to any line of property/casualty coverage.
Unusual to see this explained so clearly and understandably. Thank you!
Thank you for your feedback - that is great to hear. SIGMA strives to provide easy-to-understand resources on actuarial and analytical topics. Find more resources like this one in our complimentary educational portal: https://risk66.com/education
Excellent summary !
Thank you
Thank you Mark! We are glad you found the article useful.