Calculating a benchmark loss projection for workers compensation requires two key pieces of data: loss costs and payroll, each broken down by state and class code. While payroll amounts are typically available to companies from internal sources, loss cost information must be gathered externally.
Currently, thirty-four states around the US engage NCCI as their advisory organization for all workers compensation related matters, meaning NCCI serves as the primary source of loss costs for those states. The remaining states offer this information through their own, state-specific rating bureaus. A table containing the list of non-NCCI states can be found below:
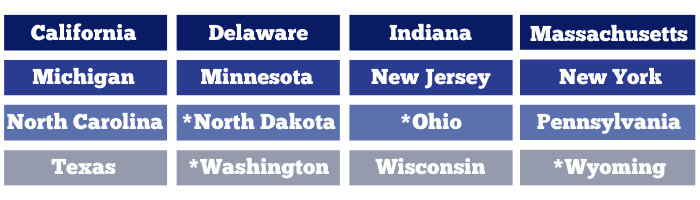
*note that these states are “monopolistic,” meaning each state has a government-owned and operated fund that provides workers compensation insurance. The remaining non-NCCI states operate state-wide advisory entities that hold a similar function to NCCI.
What are class codes?
Class codes segment various types of business using common, shared characteristics, allowing insurance companies to categorize and provide insurance at scale. These characteristics differentiate work duties and employees’ associated risk levels.
What is a loss cost?
To illustrate what exactly a loss cost represents, let’s examine two types of duties that might be undertaken by an employee: dairy farming and clerical work. As you might imagine, the inherent risk associated with these duties is substantially different, and this difference is quantified through the loss costs associated with each duty’s class code.
A loss cost conveys the average cost in losses from a particular business segment in relation to an exposure base. For workers compensation, the exposure base is often payroll. In today’s world, annual company payrolls can stretch to ten figures or higher, so common practice is to use a loss cost per $100 in payroll. In North Carolina, for example, the average dairy farmer loss cost may be $2.18 per $100 of payroll, whereas an average clerical worker loss cost might be $0.09 per $100 in payroll.
How do I calculate a benchmark loss projection?
For this basic example, let’s calculate a benchmark 2022 loss projection for Business XYZ, which operates market gardens and cultivation facilities in Nebraska.
- We’ll assume XYZ’s 2022 payroll is estimated at $1,000,000 and that all of XYZ’s operations are in the 0008 class code.
- For illustrative purposes, we’ll also assume that the loss cost for class code 0008 in Nebraska is currently $1.86.

Based on this information, we would expect XYZ’s workers compensation losses in 2022 to be $18,600. Note that actual loss experience will almost certainly deviate from this amount, but it provides a solid, analytical baseline for expectations. It might also be used (along with carrier expense estimates) to determine the workers compensation insurance premiums charged to XYZ.
In reality, companies will have payroll in multiple class codes, and they may also have operations spanning multiple states. When calculating a benchmark loss projection for entities with payroll in multiple class codes and states, we would still use the same methodology outlined above for each class code in all applicable states. The sum of the loss amounts calculated would then be considered the total benchmark loss projection for that entity.
Note that loss costs are normally calculated on an unlimited basis, meaning they do not reflect the impact of per occurrence or aggregate retention policies. When dealing with companies with relatively small payrolls, it’s important to remember that the resulting benchmark loss projections are also unlimited. As such, they may be very low compared to actual loss experience, especially when impacted by a high-severity event.
Creating benchmark loss projections may require numerous calculations, but fortunately, each individual calculation is relatively simple. Benchmarks such as these provide companies with an analytically based method of determining how their loss experience compares to their industry peers. They may also be used when sufficient historical loss experience is not available and are often a key component of deriving projected loss amounts for newly formed or newly acquired entities.
We welcome your feedback by posting a comment or contacting us at support@SIGMAactuary.com.
© SIGMA Actuarial Consulting Group, Inc.