I wear a lot of hats here at SIGMA and the one that I enjoy the most is the role of teacher and communicator. I am always looking for an opportunity to support our agents/brokers with communication and educational materials. When I hear about a concept that is difficult for our clients to grasp, I attempt to prepare a “one pager” on the concept for our Powered by SIGMA broker portal.
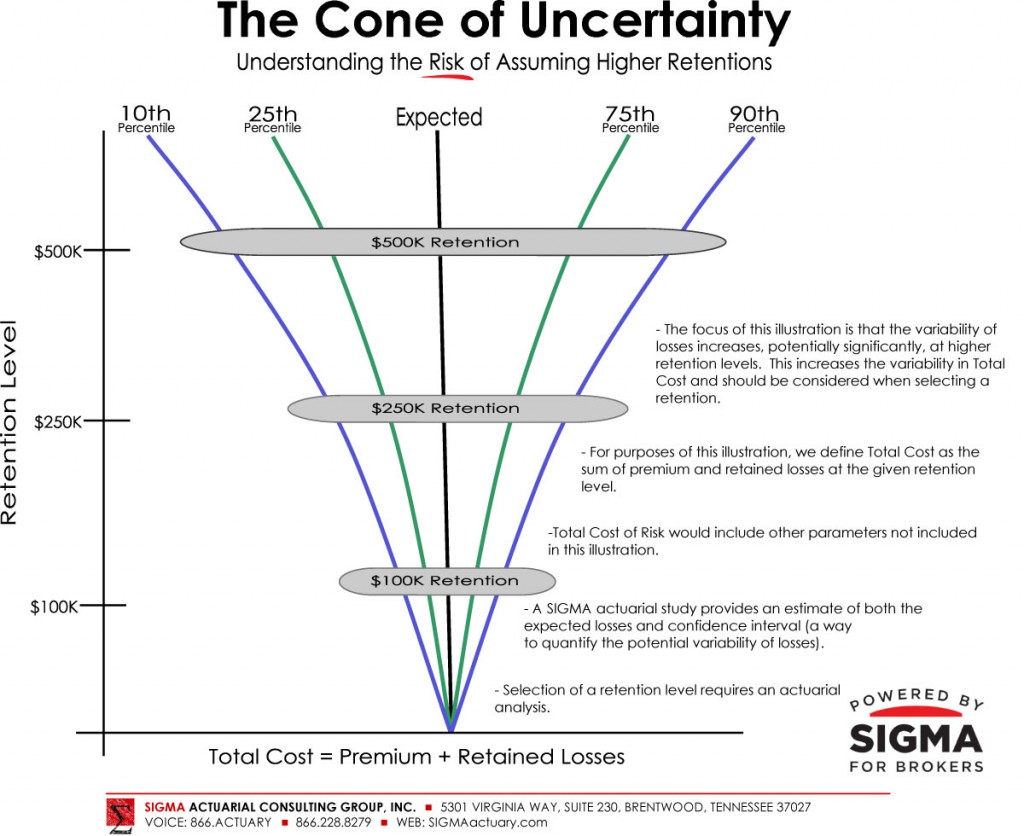
In this blog, we will tackle the concept of "The Cone of Uncertainty." I was familiar with this concept from my days working in the "Star Wars" program that Ronald Reagan kicked off back in the 1980's. But, I had not thought about that term until Michelle Bradley, ACAS, MAAA, one of SIGMA’s consultants, mentioned a concern about whether or not clients fully understand the risk they assume when moving from a low retention to a higher retention. The term “Cone of Uncertainty” popped in my mind and I immediately saw this cool graphic that I thought would be helpful for brokers when explaining the realities of higher retentions.
First, let me set up a small case study for us to think about. You are the broker for a manufacturing firm that is growing rapidly. Three years ago they moved their workers compensation program from a guaranteed cost program to a $100,000 per occurrence deductible plan. After a fairly positive experience, they now want to consider a $500,000 per occurrence plan. For purposes of this simple case we will ignore the aggregate limit.
Typically, in order to make this decision you would look at the expected losses that the employer would retain at the $100,000 deductible and the expected losses the employer would retain at the $500,000 deductible level. Compare this difference in retained losses to the difference in premium and the decision is pretty straight-forward. Or, is it? By increasing the retention you have moved further up into the "Cone of Uncertainty" and have accepted an increased risk in the potential variability of losses.
SIGMA typically communicates this additional risk by completing a confidence interval analysis as part of the actuarial analyses completed for a client. I encourage you to read SIGMA’s Tech Talk: Understanding Confidence Intervals or download a copy of our booklet, Actuarial Advantage. Both can be found in SIGMA's complementary resource portal. Register here.
But, the purpose of this blog is to introduce our first SIGMA Graphic: Understanding the Cone of Uncertainty.
Let's look at the graphic below (also found in our resource portal)

As you can see, the concept demonstrated in this graphic is that as you increase retentions you typically are also increasing the potential variability of total cost. This subtle point can be lost sometimes when a client faces the decision to change the retention level. I hope this graphic will help you introduce the topic of increased loss variability at higher retention levels. If you have questions or comments, please email me at TLC@SIGMAactuary.com
 If you would like access to this graphic along with all the other resources we have developed, please register (it's free!) at www.SIGMAactuary.com/register
