Generally, SIGMA uses two items to calculate projected losses: a pure loss rate and an exposure. The rate is selected based on historical experience, and the exposure is normally a projected estimate provided by the client and may be based on the year over year changes in their prior exposures. In times of significant exposure adjustments, it is important for companies to monitor these changes and examine how they might impact their actual losses. This type of examination may involve reviewing recent actual exposures on a monthly basis and considering current economic data. Below, you will find a few considerations for the three major property casualty coverages impacting most companies.
Workers Compensation
For workers compensation, companies that shut down may have decreases in payroll and changes in the mix (by job type) to payroll.
For workers compensation, the loss projection formula looks like:
$5.00 rate (per $100 of payroll) times $100,000,000 payroll equals $5,000,000 of losses.
You may think that, if payroll decreases to $60,000,000, then the projected losses will look like:
$5.00 rate (per $100 of payroll) times $60,000,000 payroll equals $3,000,000 of losses.
While this is not entirely inaccurate, we believe ending the analysis there will leave companies at the low end of a reasonable range. The frequency of claims may not change, but it is worth considering a potential increase in claim severity due to a higher mix of soft tissue injuries. It is not unusual to see these types of injuries being reported more often when employees are out of work, which can drive up the severity of a claim as well as the rate.
To dive into this formula a little deeper, consider a company with a 55% mix of medical costs and a 45% mix of indemnity costs. Our previous $3,000,000 loss projection would then be comprised of $1,650,000 of medical losses and $1,350,000 of indemnity losses. Assume that indemnity losses stay the same and medical costs increase 10%, 20%, or 30%. The projected losses and pure loss rates steadily climb:
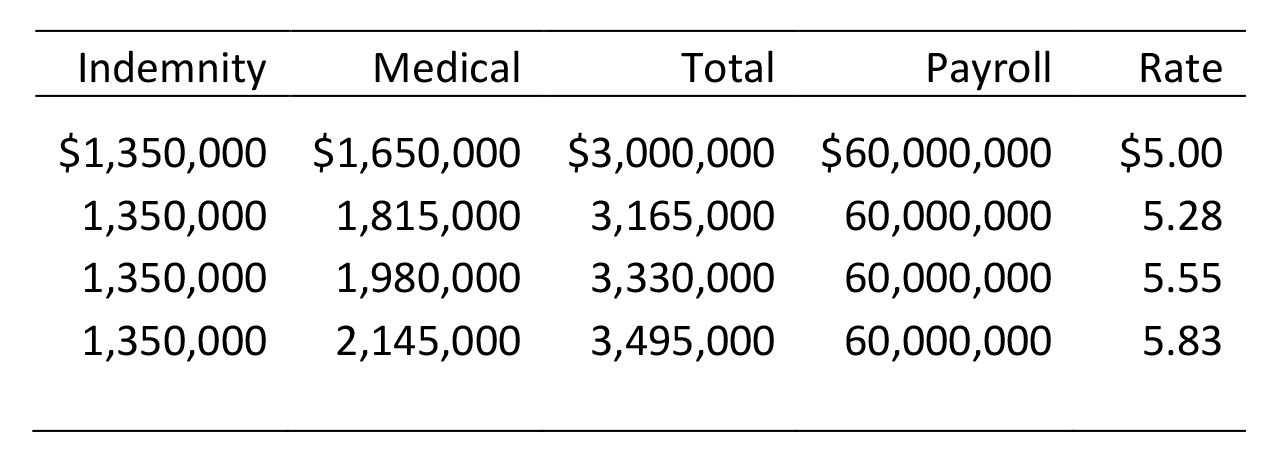
This high-level example is only meant to show that the analysis is more complex than just changing the exposure base, and it does not include changes to other parameters, such as ALAE or medical only claims. A more in-depth look into your own company or client’s exposure will likely involve many other metrics. Consider the following list of items that may be helpful in internal discussions:
- How is the payroll changing in volume, by class code, by employee age, by state, and by experience?
- Are some workers being paid without performing any duties while on furlough?
- Are there increased risks or safety concerns for employees?
- As current loss data emerges, is there a noticeable change month over month in frequency (per unit of payroll) or severity? What if this loss data was compared to experience in the prior year?
- As current loss data emerges, is there a noticeable change in indemnity versus medical?
- Will the losses be impacted by upcoming regulatory requirements?
- Will the losses be impacted by detailed policy information?
Automobile Liability
In theory, companies using mileage as their exposure base can easily account for these types of changes, but what about companies using vehicle counts? For this scenario, they will have to determine how many “full time” vehicles should be used in the calculation. SIGMA’s clients are reporting an expected drop in accidents with fewer cars on the road, meaning the pure loss rate should decrease. Unfortunately, there is no obvious way to determine by how much. Other entities, such as restaurants, may have a decrease in operations but increased vehicle activity focused on delivery. Consider the following list of items that may be helpful in internal discussions:
- How is the exposure changing in terms of mileage and driver experience?
- Are there increased or decreased risks or safety concerns for the vehicle fleet?
- As current loss data emerges, is there a noticeable change month over month in frequency (per exposure) or severity? What if this loss data was compared to experience in the prior year?
General Liability
General liability varies widely by company and a wide range of exposures must be considered. As examples, many companies use revenue as their exposure base, but the retail industry may use store count, public entities may use expenditures, and religious institutions may use number of churches or members. Consider the following list of items that may be helpful in internal discussions:
- How is the premises liability exposure changing in regard to customers or the public physically being on property?
- Are there increased or decreased risks or safety concerns for customers or other third parties?
- As current loss data emerges, is there a noticeable change month over month in frequency (per exposure) or severity? What if this loss data was compared to experience in the prior year?
Conclusions
Over the coming months, many new and existing approaches will be used in estimating changes in future losses as companies seek ways to accurately predict the impact of our current situation. With so many potential moving parts, it is important to recognize that any initial suggestions should remain at a high level until actual data begins to emerge. A mid-year actuarial analysis could assist in monitoring the loss emergence for the first 5-6 months of the year, and drill-down analytics could help companies choose areas of focus. Regardless of the methods being used, close monitoring will prove crucial to successfully navigating a rapidly changing environment.
We welcome your feedback by posting a comment or contacting us at support@SIGMAactuary.com.
© SIGMA Actuarial Consulting Group, Inc.