Excel Tips for Loss Runs - Filters, Pivot Tables, and Formulas

Alex Leaf, Actuarial Analyst

Excel is often seen as a foundational tool for anyone wishing to navigate and organize large sets of data, but getting acclimated to working in Excel can feel like a daunting task. Thankfully, there are numerous easy-to-learn tools such as filters, pivot tables, and cell formulas which can make the learning process much easier.

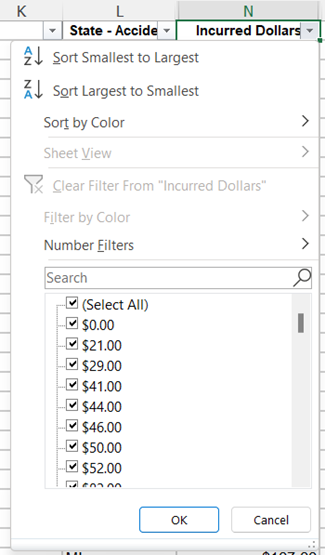
Using Filters in Loss Runs

One of the most common data sets used in the insurance industry is the loss run, which may be provided in Excel format.  If, for example, one is tasked with identifying a claim or group of claims within a loss run, one of the most effective methods of doing so is to make use of the Filter tool. In order to do so, one must first highlight the cells desired to be filtered.  From there, they’ll find and select the “Data” tab at the top of the screen.  Within the “Data” tab, they’ll select the “Filter” option, as shown in the image above.
By clicking on the arrow next to any column header, the loss run can be sorted based on the data presented in that column. For example, a column containing incurred losses by claim can be sorted by highest to lowest value, lowest to highest value, all claims above or below a certain value, and much more. Another example pertains to the loss or occurrence date field. Dates can be filtered based on oldest to newest, dates within in a certain month, specific days, and other options. Multiple filters can even be used at once.

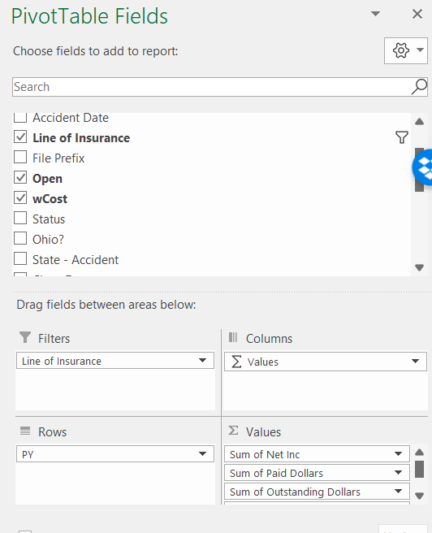
Summarizing Loss Data Using a Pivot Table

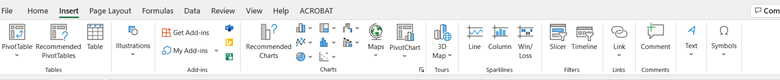
Pivot tables can be used to summarize and reorganize large data sets.  In this example, let’s assume we’ve been tasked with summarizing a large set of claim data by policy period. To create a pivot table in an Excel-based loss run, highlight all relevant data, including column headers, then navigate to the “Insert” tab at the top of the screen and select the “PivotTable” option.

A dialog box should appear on the screen making sure the data range is correct. Make sure the dotted line is capturing all of the desired loss data. Then, select “OK” in the small pop-up box. Excel should direct you to a new tab with a “PivotTable Fields” section to the right of the screen. Now, the loss data can be organized as needed. In this example, we would want to drag the column heading corresponding to the policy period in the loss run from the top of the “PivotTable Fields” section into the “Rows” area at the bottom of the “PivotTable Fields” section.
Next, drag the field corresponding to incurred loss amounts into the area labeled “Values” near the bottom of the “PivotTable Fields” section. Now, the total amount of incurred losses by policy period is summarized in an easy-to-read table. Multiple fields can be placed in the “Values” section to add additional columns to the pivot table containing those summarized data points. For example, incurred losses, paid losses, and outstanding reserves can be compared for each policy period by dragging each field into the “Values” area together. Of course, this example is only scratching the surface, as pivot tables have many more applications.

Inserting Rows, Columns, and Formulas into a Loss Run

Sometimes, it’s necessary to add additional rows or columns to an Excel-based loss run.  To insert a column, right-click the column to the right of where the column should be inserted. Then, from the popup menu, select “Insert.” A blank column will then be inserted to the left of the column selected. A similar process is used to insert a row. Right-click the row number below where a row is needed to be inserted, then select “Insert.” A row will be inserted above the row selected. To insert multiple columns or rows, simply highlight multiple columns or rows, then right-click and select “Insert.”

Columns or rows should be inserted corresponding to the number of columns or rows highlighted.
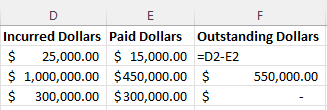
Adding a Formula to a Loss Run

When working in an Excel-based loss run, formulas can be added to automate certain calculations or add further value to the data presented. To create a formula in a cell, select the cell where the formula will be implemented, select the Formula Bar located just beneath the Toolbars, and type in the “=” sign. This will signal to Excel that a formula will be used. From there, any formula can be inserted. It can even be as simple as “=2+2” (which will output 4). An important application of formulas in Excel is to apply computation between multiple cells. For example, if you insert a column to calculate outstanding reserves, select a cell and type in the “=” sign. Next, select the cell corresponding to “incurred losses” for that claim. Then, press the “-“ key and select the cell corresponding to “paid losses” for that claim. After pressing “Enter,” Excel should subtract the values in these two cells and output the difference.

Instead of creating the formula for every row, select and drag the box in the bottom right corner of the cell to apply the formula for every row above or beneath your selection.  To delete a column, right-click the column and select “Delete.” Select multiple columns at once to delete multiple columns.These tools are just a few of many that Excel has to offer to organize data. Hopefully, these tips will help the next time you want to sift through a loss run or other data sources in Excel.

Looking for more simple excel solutions when working with loss runs? Register for access to our complimentary RISK66 Education License today! There, you can watch our recent Lunch and Learn webinar recording that highlights tips and tricks that anyone can use to create useful analytics from an Excel loss run.

We welcome your feedback by posting a comment or contacting us at support@SIGMAactuary.com.

Leave a Reply

Your email address will not be published. Required fields are marked *

Archives

Recent Posts

Navigating Premium Deficiency Reserves
SIGMA is pleased to announce the release of our newest educational resource, the Premium Deficiency Reserve Calculation sample. This resource provides an illustrative example of the calculation of a premium deficiency reserve (PDR). A company must record a PDR when the unearned premium of in-force b...
Read More
A Reflection on Data and Analytics for Captives
In a recent article published by Captive International, Michelle Bradley and Enoch Starnes discuss, “A Reflection on Data and Analytics for Captives". In it, they examine the business world’s reliance on data and analytics as decision-making tools, and how it has undoubtedly increased over the p...
Read More
Adapting Your Captive for a Shifting Risk Landscape
In a recent article published by Captive International, Michelle Bradley and Enoch Starnes discuss, “Adapting Your Captive for a Shifting Risk Landscape". In it, they examine how a company’s risk profile can shift dramatically and without any warning. The impact of a global pandemic, a rising ...
Read More
Navigating Legislative Changes for Healthcare Entities
January is here, and with it comes the need for many companies to complete their annual actuarial report for retained liabilities. If the past several years are any indicator, legislative changes and social inflation could significantly impact the loss reserves and projections prepared in these repo...
Read More

Subscribe to Our Blog


hello world!
Copyright © 2023 – 2024 SIGMA Actuarial Consulting Group, Inc. All Rights Reserved.
chevron-down linkedin facebook pinterest youtube rss twitter instagram facebook-blank rss-blank linkedin-blank pinterest youtube twitter instagram